Cytotoxic T-Lymphocyte Polarization Movies

These movies show the dynamics of the process of Cytotoxic T-Lymphocyte polarization towards cognate target cells. As a T-cell prepares to kill its target, it repositions its Microtubule Organizing Center (MTOC) to lie just underneath the target contact site. This allows the T-cell's killing machinery to be focused only on the recognized target cell and prevents harm to any surrounding, healthy tissue. The dynamics of this MTOC repolarization has been seen for the first time in living T-cell-target pairs using a unique imaging technique called Modulated Polarization Microscopy.


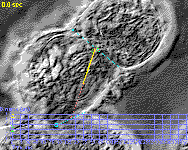
CTL Killing a Target

This sequence shows the entire process of MTOC polarization and killing. As the sequence progresses, the T-cell's MTOC (lower left) travels in a straight line to the target contact site. After 380 seconds, the target cell (top) is lysed. The distance in mm from the MTOC to the target contact site center is plotted as the sequence progresses.

Quicktime video 15x Speed (15.9 MB)
High quality MPEG 34x Speed (8.5 MB)
Low quality MPEG 34x Speed (2.1 MB)
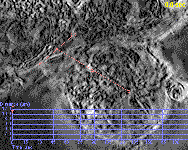
 

MTOC Pulled to Target

In this sequence, the T-cell's MTOC (lower right) starts on the opposite side of the nucleus from the target cell. As the sequence progresses, the MTOC is drawn in a straight line directly to the target contact site (upper left), pushing nuclear material aside as it goes. The measured MTOC position, target contact site endpoints, and contact site center are shown. Each measurement was repeated five times, and the size of each oval represents one standard deviation of measurement error. The distance in mm from the MTOC to the target contact site center is plotted as the sequence progresses.


Quicktime video 15x Speed (14.0 MB)
High quality MPEG 18x Speed (6.3 MB)
Low quality MPEG 18x Speed (1.5 MB)


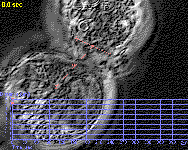
Two Target Tango

This T-cell (center) is bound to two target cells at once (top-right and bottom-right). The MTOC vacillates between the two targets before settling on one. The MTOC follows an straight line between the two contact sites. The perpendicular distance in mm (V, green) from the MTOC  to the line between the two target contact sites is plotted as the sequence progresses, as well as the MTOC position along this line (H, yellow), measured from the center of the line. While the position of the MTOC along the line (H) varies by 8 mm, the MTOC strays less than 1 mm from this line, as shown by V.


Quicktime video 15x Speed (12.9 MB)
High quality MPEG 34x Speed (7.5 MB)
Low quality MPEG 34x Speed (2.0 MB)