In this analysis, I will walk through the step by step analysis of the ARID domain, as found in the mouse Bright protein.
The first step is to assemble an alignment of proteins. In this case we will analyze the mouse Bright protein.
1. Identify the Entrez record for the protein of interest. Here is the Entrez record for the 601 amino acid mouse Bright protein.
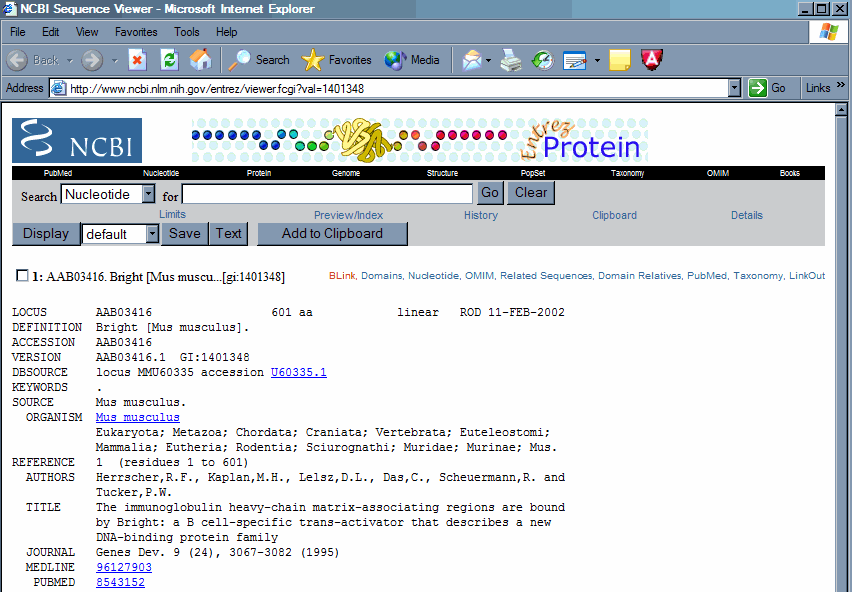
2. Use BLINK found as a link within the Entrez record to bring up a list of similar proteins. From the Entrez record click the BLINK link to go to a precompiled BLAST search against the nonredundant protein dataset. This offers a graphical view that quickly shows which regions of the protein are conserved.
Your BLINK screen should look like this.
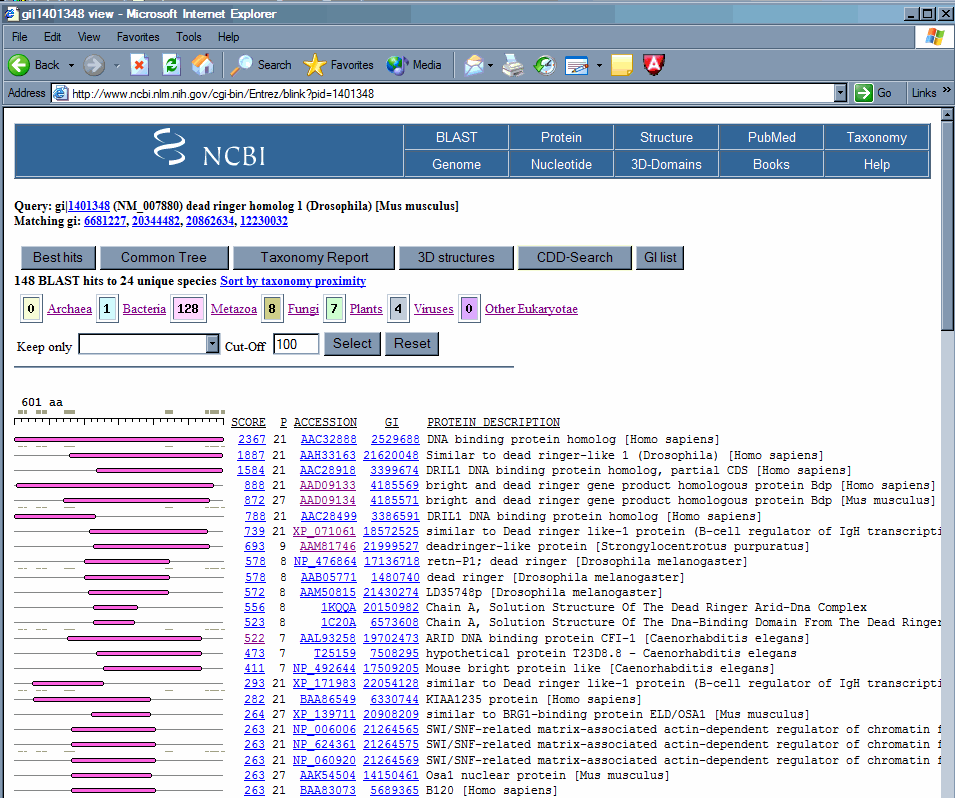
The number in the score column can be used to judge the quality of the match. In this case the top seven scores are all mouse and human proteins. Although the dataset searched is reported as non-redundant, in fact, this only means that the records are not exact duplicates, but does not rule out proteins with only minor differences or truncated proteins that all eminate from the same gene. Of these seven top scores, there are only four unique genes. Three human and one mouse, the top three hits are amino terminal truncations of the same gene, in this case the human ortholog to the mouse Bright gene.
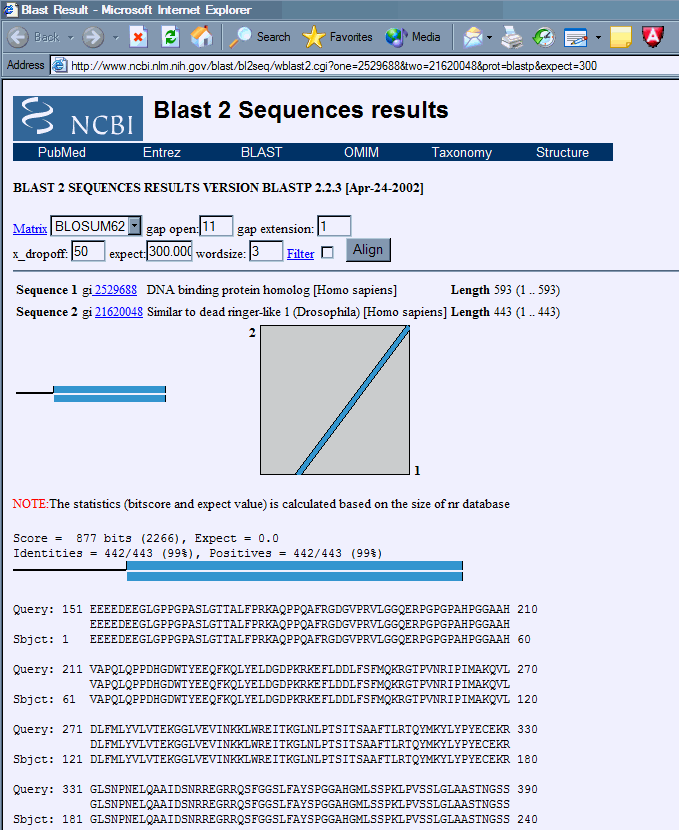
3. Identify duplicate records. These records can be most easily identified by clicking on the accession number of the protein in question to bring up the protein record, and then using the BLINK you will see that the duplicates will have very high numerical scores. By clicking on the score link you can see the alignment of the proteins. As you can see these two records are exact matches, the one being a truncation of the other. Except in extremely recent duplications there is almost always some divergence at the protein level between paralogous genes, even within conserved domains. So you are usually safe to assume that any completely identical proteins or conserved domains within the same species eminate from a single gene. In order to be completely sure, it is necessary to compare the nucleic acid sequences to verify that they are identical, and then make sure that there is not more than one locus in the genome capable of generating the message.
4. Find regions of conservation. Return to the original mouse Bright protein BLINK (here) . Notice that as you scroll down the list, many of the hits are relatively short, and in the same region of the protein. This region of the protein which is conserved between many proteins from a wide variety of organisms may be (and in this case is) a conserved domain.

The colors indicate the broad class of organism from which the sequence came.
![]()
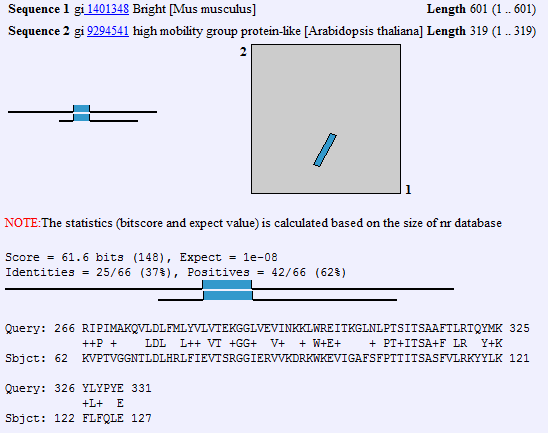
we can again click on the link in the score column to display the protein alignment. In this case, we can identify the region that is the conserved domain. We can see that the domain is located roughly in the region of the mouse Bright protein encompassing amino acids 266 to 331 is the region conserved to this plant gene. We will use this as the 'root' of our alignment. Then after aligning a few sequences we will see if there are residues that are commonly conserved, as we would expect in a true conserved domain. If the region is not complex, but has a lot of certain types of amino acids, which can occur in acidic or basic patches, or serine/threonine rich regions, then the protein homology that exists may be a matter of convergent evolution rather than descent from a common ancestral protein.
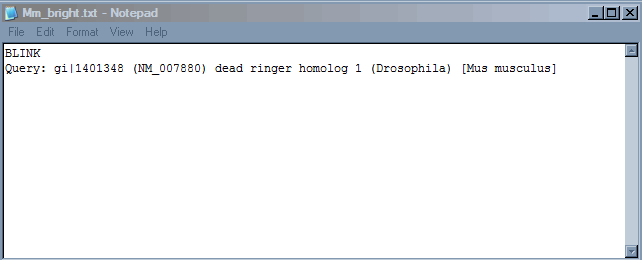
5. Taking notes. It is useful to keep a running log of your work. I keep track within a notepad file (any text editor will do). In this example we can report the query line that is at the top of the BLINK page, we want to maintain sufficient detail to allow someone to duplicate or verify our work.
6. Now we are ready to begin to align the conserved domain. Open the original protein by right clicking on the link at the top of the page and opening in a new window.

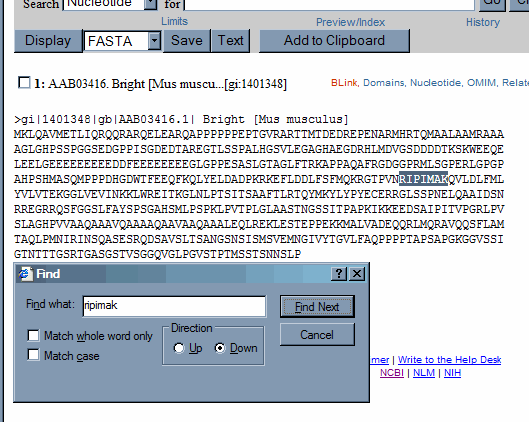
What we want is just the region of the protein that contains the conserved domain, and a some amino acids up and downstream. After we have the alignment we can trim the sequences. It is easier to have to much and cut, than to have to little and have to re-acquire the record. (although this is not greatly difficult either). We know that the sequence that is conserved between the plant gene and the mouse Bright gene, starts off at amino acid 266 in the mouse gene and begins with the sequence RIPIMAK. We want to scan the mouse protein amino acid sequence for this string of characters.
To get the amino acid sequence in a usable form, we will want the entire protein displayed as a long string of amino acids, however in the record displayed it is broken by numbers and is in blocks of ten amino acids.

this is because we are displaying the record in the genbank format, which lists protein (and nucleic acid) sequence in this format. At the top of the screen switch to the FASTA display type in the pulldown menu next to display and then hit the display key. The record is now displayed in FASTA format, which has a single header following a > sign, followed by the uninterrupted sequence.
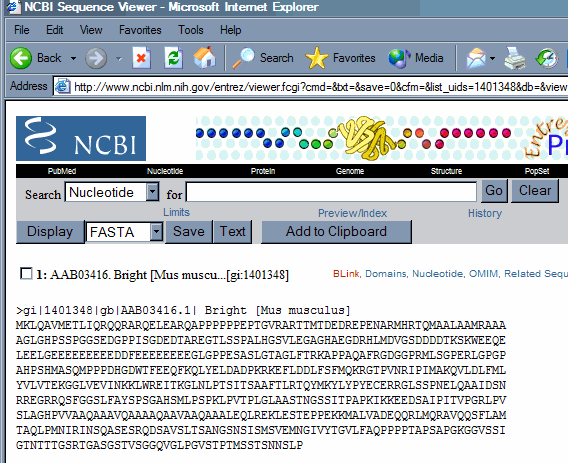
Exact matches within the text of the record can be identified using the Find (on this page) command within the Edit menu of the browser. Search for the RIPIMAK string.
Now cut the sequence corresponding to the conseved domain and include some additional sequence up and downstream. Open a new alignment within the Bioedit program and from within the file menu, use the import from clipboard command. This will transfer the sequence on the clipboard into the aligment.
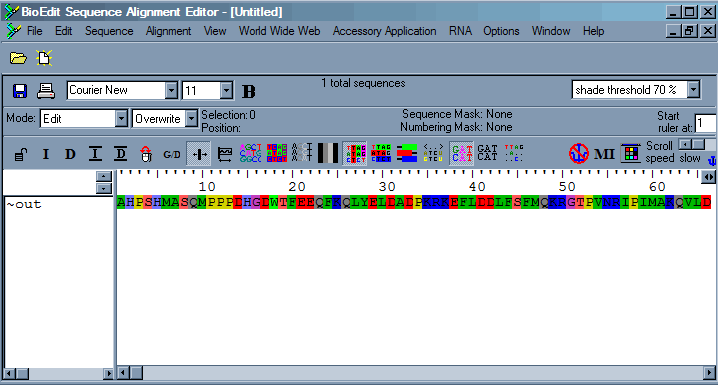
The sequence will not have a name, so you will want to double click on the sequence within Bioedit which will open an edit window. Give the sequence a name, such as Mm_bright, and hit the apply and close button. You will want the sequence name to be unique within the first 12 characters as some programs used in later analysis will not work otherwise.
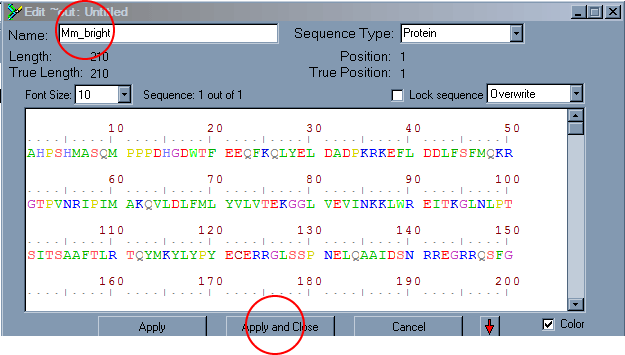
You have now entered your first sequence in the alignment. Now go to the
appendix 1: software and websites used in the analysis.
notes on software used: I am trying to use free and open source programs or web based software in this analysis as much as possible. This allows you to work from any workstation that is connected to the internet. A fast connection to the internet is preferred but not essential.
appendix 2: source data and data sources